Deconvolve .Net
Results with 1D Signals
|
Deconvolution of an Audio File
The figure above shows the results of using the BiaQIm image processing suite to restore an audio signal (only a small part of the full signal is shown). The audio signal shown here is the same one you can download as a demo via this site - and if you run the demo you should get the same results as shown here (and listen to the audio files so you can hear what this sounds like).
An audio file is an example of a 1D signal and the same principles apply to other 1D signals such as infra-red spectra, fluorescence decay profiles, seizmic data or electrical signal such as those generated via an ECG or EEG machine.
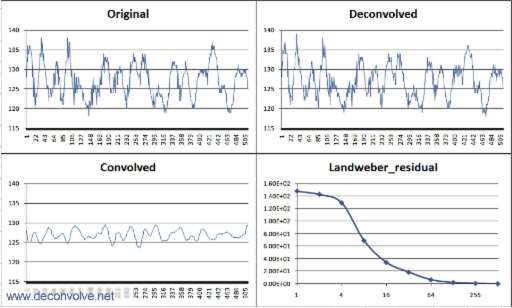
Top left of the figure shows the original signal. Bottom left shows the signal after it was currupted by convolution with a known PSF (the PSF is not shown here but is contained in the demo package that you may download). On the top right is the deconvolved result. Note that it is not exactly the same as the original but much of the original shape is restored. Bottom left is the residuals graph where the residual error is plotted on the ordinate vs. iteration number on the abscissa. The deconvolution used in this example is the iterative method of Landweber and was accelerated using Biggs' additive vector extrapolation to the second order expansion of the Taylor series (Biggs_AVE2).
Although the signal has not yet been fully recovered, the solution was still improving at the time the iterations were terminated but were asymptoting to a minimum. This indicates that to get even better results would require an excessively large number of further iterations - but it is possible.
|
